2.9 Million Views for My YouTube Channel – DannyRocksExcels

2.9 million viewsThis morning, I passed the 2.9 Million views milestone for my DannyRocksExcel’s YouTube Channel!

Thank you to all who have supported my Excel tutorials since I began posting them in August, 2008.

Top 10 Excel YouTube Videos Year-to-Date in 2013

Here are the Top 10 Videos that have been viewed so far (January 1 – March 21) in 2013. Click on the hyperlink to watch the video(s) on YouTube:

  1. How to Create an Interactive Pivot Table Chart – 65,095 Lifetime views
  2. How to Use Advanced Filters in Excel – 84,557 Lifetime views
  3. How to Add a Check Box Control to an Excel Form – 87,327 Lifetime views
  4. Compare 2 Excel Lists to Spot the Differences – 84,325 Lifetime Views
  5. Use Excel’s Built-in Data Form to Edit & Filter Records – 65,325 Lifetime views
  6. Use the Solver Tool in Excel – 46,035 Lifetime views
  7. How to Use an Excel Data Table for “What-if” Analysis – 72,694 Lifetime views
  8. How to Merge Multiple Excel Workbooks to a Master Budget – 104,376 Lifetime views
  9. How to Create a Summary Report from an Excel Table – 38,502 Lifetime views
  10. Import Excel Data into Microsoft Access – 54,601 Lifetime views

Quickly Improve Your Excel Skills

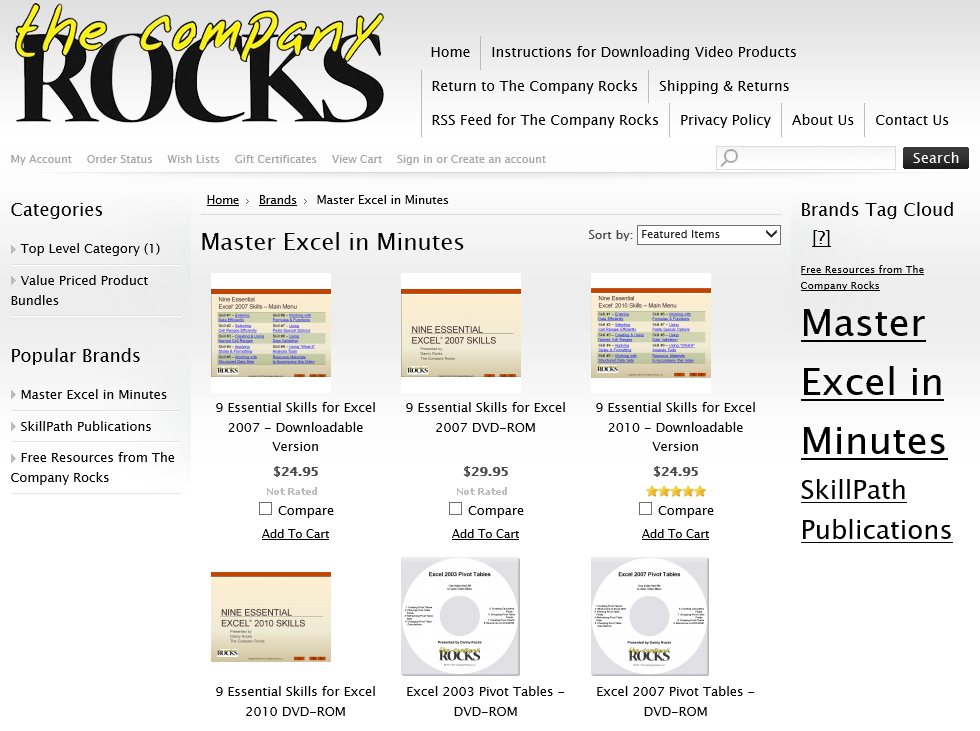
I have created many Video Tutorial Packages that I offer for sale at my secure online shopping website – http://shop.thecompanyrocks.com I invite you to visit and preview my training resources for MS Excel and the other programs in the Microsoft Office Suite.

The “Special Bundles” of videos are very attractively priced!


Share and Enjoy:
  • Add to favorites
  • Facebook
  • Twitter
  • Technorati
  • Print
  • email
  • Digg
  • StumbleUpon
  • del.icio.us
  • Yahoo! Buzz
  • Google Bookmarks
  • Orkut
  • SphereIt
  • Sphinn

How to Work with Numeric Values in an Excel Pivot Table

Value Field Settings for Pivot Table

Value Field Settings for Pivot Table

One of my clients contacted me with a question about Excel Pivot Tables. Specifically, about how to control a field – Employee ID – that contains numeric values.

Beginning with Excel 2007, when you click – to add – a field that contains numeric values, it is automatically placed in the Values Zone of the Pivot Table and the Sum Function is used to Subtotal it. That is what was troubling my client.

It is really easy to change the location for any field in the Pivot Table. In this case, I moved the Employee ID to the Row Labels area and everything worked out nicely.

Value Field Settings for Pivot Table

In my experience, I use the commands in the Value Field Setting Dialog Box more than any other commands when working with Pivot Tables. Learning how to use the Value Field Settings Commands is an Essential Skill when working with Pivot Tables. In this video tutorial, I demonstrate how to:

  • Change the function used to subtotal a field
  • Change the name of the subtotaled field
  • Change the numeric formatting for the subtotaled field
  • Move fields to different drop zones in a Pivot Table
  • Expand and collapse entire Pivot Table fields
  • Remove fields from the Pivot Table

Video Training Resources for Sale

I invite you to visit my secure online shopping website – http://shop.thecompanyrocks.com – to see the many video training resources that I make available.

Watch Video Tutorial in High Definition

Follow this link to watch this video in High Definition on my YouTube Channel – DannyRocksExcels

Share and Enjoy:
  • Add to favorites
  • Facebook
  • Twitter
  • Technorati
  • Print
  • email
  • Digg
  • StumbleUpon
  • del.icio.us
  • Yahoo! Buzz
  • Google Bookmarks
  • Orkut
  • SphereIt
  • Sphinn

Excel Pivot Tables Tutorials: My YouTube Playlist

I have been organizing the video tutorials on my YouTube Channel – DannyRocksExcels – into Playlists.

I quickly realized that I have more videos (70 +) that focus on Excel Pivot Tables than on any other topic. So, having a playlist for all 70 (and growing) Pivot Table Tutorials is a great help when you need to learn about Pivot Tables. Or, simply to refresh your memory about how to use a specific Pivot Table Tool.

Scope of My Pivot Table Tutorials

I posted my first Pivot Table Tutorial on YouTube back on August 1, 2008. So far, that 7 minute Introduction to Pivot Tables in Excel 2003 has received over 90,000 views! Since then, I have created Pivot Table videos for Excel 2007 and Excel 2010.

Front Page of Online Shopping SiteIn-Depth Focused Training for Excel Pivot Tables

I invite you to visit my secure online shopping website – http://shop.thecompanyrocks.com – to learn about the many training resources that I offer you.


Link to My Excel Pivot Tables Playlist

Follow this link to go to my Excel Pivot Tables playlist on YouTube. If you like this Playlist, I encourage you to share it with your friends and colleagues.

Excel Pivot Tables Playlist on YouTube

Share and Enjoy:
  • Add to favorites
  • Facebook
  • Twitter
  • Technorati
  • Print
  • email
  • Digg
  • StumbleUpon
  • del.icio.us
  • Yahoo! Buzz
  • Google Bookmarks
  • Orkut
  • SphereIt
  • Sphinn

How to Prevent Empty Cells from Displaying in a Pivot Table

IPivot Table Optionsn response to one of my viewers, I demonstrate how to prevent “empty cells” from displaying in a Pivot Table Report. In my experience, I have found that clients and colleagues who are unfamiliar with Pivot Tables tend to “doubt the numbers” when they see these “empty cells.”

What You Will Learn

In my video, I demonstrate:

  • How to use Pivot Table Options to show a Zero instead of “blanks.”
  • How to “drill down” to reveal the details for any Subtotal.
  • How to use a great Keyboard Shortcut to apply and clear Filters.

Learn More About Pivot Tables

Pivot Tables Video Tutorial

Pivot Tables Tutorial

I have published a 90 minute video tutorial focused exclusively on Pivot Tables and Pivot Charts. The package includes:

  • 9 Video Tutorials – total of 90 minutes of video instruction.
  • Step-by-Step Instructional Manual as a PDF for you to use as you watch the videos.
  • The Excel Worksheets that I use in each video lesson so that you can practice your new skills.

I make this video training resource available both on DVD-ROM and as a Downloadable Product. Versions are published for Excel 2010, Excel 2007, and Excel 2003.

I invite you to visit my secure online shopping website – http://shop.thecompanyrocks.com – to learn more about all of my training resources.

Watch Video in High Definition

Follow this link to watch my video in High Definition on my YouTube channel – DannyRocksExcels.

Watch Video Now


Share and Enjoy:
  • Add to favorites
  • Facebook
  • Twitter
  • Technorati
  • Print
  • email
  • Digg
  • StumbleUpon
  • del.icio.us
  • Yahoo! Buzz
  • Google Bookmarks
  • Orkut
  • SphereIt
  • Sphinn

Two Glowing Reviews for my Excel Video Tutorials

Today, two of my customers posted glowing reviews for my Excel Video Tutorials. Thank you! Thank you! Thank you!

9 Essential Skills for Excel 2010

9 Essential Skills for Excel 2010 Video Tutorial

“Nine Essential Skills for Excel 2010”

“In my opinion the 9 Essential Skills for Excel 2010 , is an outstanding training video. It covers a lot of the required intermediate requirements. One thing that really stands out for me is the method of presentation. Danny always:

  • a) explains what he is going to do in simple language 
  • b)demonstrates what he has just explained
  • c)shows you where to find the icons on the ribbon
  • d)shows you the keyboard shortcuts to use(they actually appear on the video as they are used.

The video also had a good introduction to the value of using tables. Like all of Danny’s videos this should be a fantastic success.

– John J, Canada

Pivot Tables for Excel 2003

“Excel 2003 Pivot Tables to Summarize, Analyze, and Present Information”

“A mere few hours with your Excel 2003 course and I was able to
perform pivot table operations which had eluded me for over a year
using multiple other publications totaling nearly 1,500 pages: while those sources are terrific, each of us learns differently, your courses certainly fill that learning gap for me.

I deal with mostly with cumulative metrics, that is, incremental, week to week.

After two evenings of your course, I was able to build tables presenting the year, month, quarter & weekly totals of the multiple tools deployed, and, amazingly, display the incremental changes down to a week-to-week basis.

You had mentioned that you hoped I enjoyed the course, of course, I enjoyed the course – indeed, but after a year-plus struggle with several other sources, the *learning* from your course was the true reward!”

– Paul B., Colorado

Learn More About My Video Training Resources

I am confident that you will learn many valuable tips and techniques from my extended length Excel Video Training Resources.My Motto is:

“I work hard to make it easy for you to get the most out of Microsoft Excel”

Follow these links to learn more about my video training resources:

Share and Enjoy:
  • Add to favorites
  • Facebook
  • Twitter
  • Technorati
  • Print
  • email
  • Digg
  • StumbleUpon
  • del.icio.us
  • Yahoo! Buzz
  • Google Bookmarks
  • Orkut
  • SphereIt
  • Sphinn

The 10 Most Watched Excel YouTube Videos for September 2012

My YouTube Channel – DannyRocksExcels – had 141,586 individual views during the month of September 2012:

Here is a list – with Hyperlinks – to the 10 Most Watched Excel Videos

Top 10 YouTube Excel Videos

  1. Compare Two Excel Lists to Spot the Differences– 5,304 views in September
    1. Go to this Blog Post on my website
  2. How to Merge Multiple Excel Workbooks to a Master Budget – 4,915 views in September
    1. Go to this Blog Post on my website
  3. How to Use Advanced Filters in Excel– 4,660 views in September
    1. Go to this Blog Post on my website
  4. How to Add a Check Box Control to an Excel Form– 4,301 views in September
    1. Go to this Blog Post on my website
  5. Use the Built-in Data Form in Excel to View and Filter Records– 3,948 views in September
    1. Go to this Blog Post on my website
  6. How to Create a Summary Report from an Excel Table-3,932 views in September
    1. Go to this Blog Post on my website
  7. How to Create an Interactive Excel Pivot Chart– 3,696 views in September
    1. Go to this Blog Post on my website
  8. Consolidating Data from Multiple Excel Worksheets by Position– 3,618 views in September
    1. Go to this Blog Post on my website
  9. How to Use the Solver Tool in Excel– 3,532 views in September
    1. Go to this Blog Post on my website
  10. How to Use an Excel Data Table for “What-if” Analysis– 3,513 views in September
    1. Go to this Blog Post on my website

Thanks to my 4,500 Subscriber on YouTube!

I extend my heartfelt thanks to my many loyal viewers and subscribers to my Excel video tutorials. Your feedback and requests for solutions have formed the foundation for my Excel Training Videos.

9 Essential Excel 2010 Skills

9 Essential Excel 2010 Skills

Learn More About my Extended Length Excel Video Training Resources

I have created a series of Extended Length Video Training Resources in the category of “Master Excel in Minutes.” I invite you to follow this link to learn more about my new series of videos.

Share and Enjoy:
  • Add to favorites
  • Facebook
  • Twitter
  • Technorati
  • Print
  • email
  • Digg
  • StumbleUpon
  • del.icio.us
  • Yahoo! Buzz
  • Google Bookmarks
  • Orkut
  • SphereIt
  • Sphinn

Take a Complete,10 Minute, Video Lesson from my Latest Publication

9 Essential Excel 2010 Skills

9 Essential Excel 2010 Skills

I am very proud to announce my latest publication – “Nine Essential Skills for Excel 2010.” I have made my publication available in two formats:

What You Get with this Preview

Here, in this preview of my publication, I offer you one, complete, ten-minute, video tutorial from my video publication. This video tutorial demonstrates how to use Subtotals and Pivot Tables in Excel 2010. On my video publication, you will find 24 additional video tutorials just like this. You will get @ 4 hours of focused video instruction to help you to master the Essential Skills in Excel 2010!

The Nine Essential Skills for Excel 2010

Here are – in my opinion – The “Nine Essential Skills in Excel 2010”:

  1. Entering Data Efficiently – 4 video tutorials Run Time: 28:42
  2. Selecting Cell Ranges Efficiently – 2 video tutorials Run Time 13:28
  3. Creating & Using Named Cell Ranges – 2 video tutorials Run Time 16:00
  4. Applying Styles & Formatting – 3 video tutorials Run Time 22:49
  5. Working with Structured Data Sets – 4 video tutorials Run Time 32:00
  6. Working with Formulas & Functions – 4 video tutorials Run Time 52:16
  7. Using Paste Special Options – 2 video tutorials Run Time 17:18
  8. Using Data Validation – 2 video tutorials Run Time 12:34
  9. Using “What-if” Analysis Tools – 2 video tutorials Run Time 15:09

I have tried to offer a range of Video Tutorials that appeal to both the beginning Level and the Intermediate Level Excel user. That is why, I decided to separate each chapter into multiple episodes. In this manner, I can offer the Beginning Level Excel User the foundational instruction that they require without “boring” a more experienced user.

Supporting Materials Included in My Publication

In addition to the 25 individual video tutorials included in my package, you will also receive:

  • A PDF Instructional Booklet that you can print out to use as you follow each video lesson.
  • The actual Excel Workbook files that I used while filming these videos that you can use to practice your new Excel 2010 skills.

Learn More About this Publication

I invite you to click on this link to learn more about the “Nine Essential Excel 2010 Skills” Video Publication

Watch this Video Tutorial in High Definition

Follow this link to watch my video tutorial in High Definition on my YouTube Channel – DannyRocksExcels

View this Tutorial Now


Share and Enjoy:
  • Add to favorites
  • Facebook
  • Twitter
  • Technorati
  • Print
  • email
  • Digg
  • StumbleUpon
  • del.icio.us
  • Yahoo! Buzz
  • Google Bookmarks
  • Orkut
  • SphereIt
  • Sphinn

How to Group People by Age Bracket Using an Excel Pivot Table

Pivot Table for Age Brackets

Pivot Table to Group Age Brackets

In my previous Excel Tutorial, I demonstrated how to use the Group Field command in a Pivot Table to summarize time periods by the Hour. Several viewers wanted to know what other grouping possibilities are available in Pivot Tables. One viewer wanted to know how to group people who responded to a survey by Age Brackets. That is why I created this tutorial!

Use DATEDIF Function to Calculate Age

From my perspective, the DATEDIF() is an invaluable function. However, it is not documented in Excel. Watch how I use its three arguments to calculate the age of each person in the data set.

Group Field by Age

Select a single value in the “Age” Field and then select the “Group Field” Command. In the dialog box, choose the “step-value” for your groups. In this case, I chose the Default Setting of 10 years.

Show Pivot Table Values As

Some of the most powerful Pivot Table tools are found on the “Show Values As” tab of the “Value Field Settings” Dialog Box. Watch me demonstrate how to show each Age Bracket as a Percentage of the Column.

Apply Conditional Formatting to Pivot Table

Take advantage of the greatly improved Conditional Formatting Commands in Excel 2007 and Excel 2010 to focus attention on the key information in your Pivot Table. In this case, I use the “Top 10 Items” rule to apply Conditional Formatting to the two highest Age Brackets- by percentage – for each gender.

Learn Excel Pivot Tables Quickly

Follow this link to learn about the focused 90 minute video tutorials that I have published to help you to really learn how to get the most out of Pivot Tables. Available in versions for Excel 2003, Excel 2007, and Excel 2010.

Watch Tutorial in High Definition

Click on this link to watch this Excel Tutorial in High Definition on my YouTube Channel – DannyRocksExcels


Share and Enjoy:
  • Add to favorites
  • Facebook
  • Twitter
  • Technorati
  • Print
  • email
  • Digg
  • StumbleUpon
  • del.icio.us
  • Yahoo! Buzz
  • Google Bookmarks
  • Orkut
  • SphereIt
  • Sphinn

How to Group an Excel Pivot Table Field to Summarize By Hours

Pivot Table Summary Report By Hour

Pivot Table Summary Report By Hour

After viewing my previous video tutorial, one of my subscribers asked me to demonstrate how to actually summarize a minute-by-minute Excel report into an hour-by-hour report.

My viewer was unfamiliar with Pivot Tables – as are many Excel users – so I created this video to show him – and you how to do this.

Group a Pivot Table Field

Begin by right-clicking a single cell in the Time Field and choosing Group Field. In the dialog box, deselect Month and choose Hour. That’s it – it’s that simple!

Apply Conditional Formatting to the Top 10%

Beginning with Excel 2007, Conditional Formatting has been tremendously improved. Watch how I apply a “Top 10%” Conditional Format Rule with three mouse clicks!

Purchase My 90 Minute Focused Pivot Table Tutorial

Whether you are a novice or an experienced user of Excel Pivot Tables, you will learn some great Tips and Techniques when you purchase my 90 minute video tutorial: “Summarize, Analyze and Present Information with Excel Pivot Tables.”

Follow this link to learn more about my video tutorial for Pivot Tables. Available for ALL versions of Excel as either a DVD-ROM or as a Downloadable Product.

Watch Video Tutorial in High Definition

Click on this link to watch this Excel Video Tutorial in High Definition on my YouTube Channel – DannyRocksExcels


Share and Enjoy:
  • Add to favorites
  • Facebook
  • Twitter
  • Technorati
  • Print
  • email
  • Digg
  • StumbleUpon
  • del.icio.us
  • Yahoo! Buzz
  • Google Bookmarks
  • Orkut
  • SphereIt
  • Sphinn

How to Roll Up a Summary by Month to Filter an Excel Pivot Table

Filter Using a Roll Up by Month Summary

Filter with a Roll Up by Month Summary

In this Excel tutorial, I respond to a viewer request. He likes the new “Roll Up Summary by Month” feature for filtering a field in an Excel 2007 – 2010 Field. What he finds frustrating – there seems to be no natural way to accomplish this with an Excel Pivot Table.

Natural Language Date Filters in Excel

Before I solve my readers dilemma, I demonstrate how to take advantage of the new “Natural Language” Date Filters that were introduced in Excel 2007. Date Filters allow you to filter records from “Today,” “Last Week,” “Next Month,” etc. They are available for Excel Tables and Excel Pivot Tables. These “Natural Language” Date Filters are a major improvement in Excel!

Group a Field for Pivot Tables

To solve my viewers question, I “Grouped” the original Date Field in his Pivot Table to produce “virtual” fields for “Month,” and “Year.” Now, it is a simple step to filter the “virtual” Month Field to obtain a “roll up” filter for individual months in the Pivot Table. Just select a single cell in the Pivot Table Date Field and choose Group Field. Make your choices in the Grouping Dialog Box and you are “good to go!”

I also show you how to take advantage of the Expand and Collapse Field Commands in a Pivot Table.

In-Depth Video Tutorial for Excel Pivot Tables

At my secure, online shopping website, you can purchase my 90-minute Video tutorial for Excel Pivot Tables. Available for immediate downloading or on a DVD-ROM. Version specific editions for Excel 2003, 2007, and 2010.

Watch Video Tutorial in High Definition

Follow this link to watch this tutorial in High Definition Mode on my YouTube Channel – DannyRocksExcels


Share and Enjoy:
  • Add to favorites
  • Facebook
  • Twitter
  • Technorati
  • Print
  • email
  • Digg
  • StumbleUpon
  • del.icio.us
  • Yahoo! Buzz
  • Google Bookmarks
  • Orkut
  • SphereIt
  • Sphinn