In my previous Excel Tutorial, I demonstrated how to use the Group Field command in a Pivot Table to summarize time periods by the Hour. Several viewers wanted to know what other grouping possibilities are available in Pivot Tables. One viewer wanted to know how to group people who responded to a survey by Age Brackets. That is why I created this tutorial!
Use DATEDIF Function to Calculate Age
From my perspective, the DATEDIF() is an invaluable function. However, it is not documented in Excel. Watch how I use its three arguments to calculate the age of each person in the data set.
Group Field by Age
Select a single value in the “Age” Field and then select the “Group Field” Command. In the dialog box, choose the “step-value” for your groups. In this case, I chose the Default Setting of 10 years.
Show Pivot Table Values As
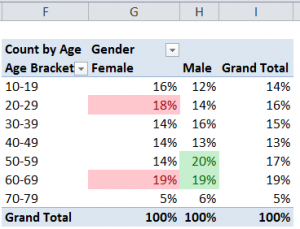
Some of the most powerful Pivot Table tools are found on the “Show Values As” tab of the “Value Field Settings” Dialog Box. Watch me demonstrate how to show each Age Bracket as a Percentage of the Column.
Apply Conditional Formatting to Pivot Table
Take advantage of the greatly improved Conditional Formatting Commands in Excel 2007 and Excel 2010 to focus attention on the key information in your Pivot Table. In this case, I use the “Top 10 Items” rule to apply Conditional Formatting to the two highest Age Brackets- by percentage – for each gender.
Learn Excel Pivot Tables Quickly
Follow this link to learn about the focused 90 minute video tutorials that I have published to help you to really learn how to get the most out of Pivot Tables. Available in versions for Excel 2003, Excel 2007, and Excel 2010.
Watch Tutorial in High Definition
Click on this link to watch this Excel Tutorial in High Definition on my YouTube Channel – DannyRocksExcels
 How to Group People by Age Brackets with an Excel Pivot Table [ 8:12 ] Play Now | Play in Popup | Download (3400)


The use of DATEIF() as demonstrated in the video leaves me with #VALUE! and #NUM! in the Age column. What could be the reason for not showing the number of the years? Thanks.
You will get a #VALUE! error if one or more of the dates that you refer to in your formula is not properly entered as a number. Check the alignment for your date entries – if they do NOT align to the Right-side of the cell, you have entered a Text Label. For a proper date entry, use this shortcut – Ctrl + ; (Semi-colon) which enters the current date. It is also possible that your cell(s) are formatted as Text – so clear ALL formatting before you enter dates and formulas.
For the “NUM! error message to appear, you most likely selected the later date as your first argument. The proper syntax for DATEDIF is StartDate, EndDate, “y” – for the difference in years.
Thanks for adding your comment!
Danny Rocks
The Company Rocks
Neli’s problem has a simple solution. The function is DATEDIF not DATEIF!
Pauline