How to Clear Cell Formatting In Excel

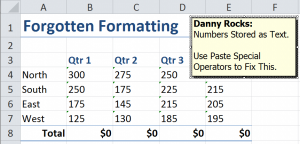
Numbers Stored as Text

Numbers Stored as Text

In my previous tutorial, I demonstrated how to clear all text formatting from all slides in a PowerPoint Presentation. Several viewers contacted me about publishing a tutorial that demonstrates how to clear formatting from ranges of cells in Excel.

Use the Clear Formatting Command

From my experience, I had found that a great many Excel users expect that formatting as well as contents are cleared when you press the Delete Key. This is not the case. The Delete Key only clears the contents of the cells in the selected range.

Use the Clear Formatting Command in the Editing Group on the Home Tab of the Ribbon. If you are using Excel 2003 or earlier, you will find this on the Edit Menu.

Numbers Stored as Text

As a Best Practice, I strongly recommend that you verify that the numeric values that you will be using in formulas are truly numbers and not numbers stored as text. This, unfortunately is a common case whenever you are working with data that has been imported from a main frame computer or other external sources. In this lesson, I demonstrate how to use Paste Special Operators to quickly convert numbers stored as text to true numeric values.

9 Essential Skills for Excel 2010

9 Essential Skills for Excel 2010 Video Tutorial

Nine Essential Skills for Excel

I cover, in-depth,  Entering and formatting data as well as using Paste Special Options on my new video resource, “Nine Essential Skills for Excel.”

  • Four hours of video training
  • 25 individual video tutorials
  • Step-by-Step Instructional Guide
  • Excel Practice Files included

Download It or Order My DVD-ROM

Watch My Tutorial in High Definition

Follow this link to watch my Excel Tutorial in High Definition on my YouTube Channel – DannyRocksExcels
Share and Enjoy:
  • Add to favorites
  • Facebook
  • Twitter
  • Technorati
  • Print
  • email
  • Digg
  • StumbleUpon
  • del.icio.us
  • Yahoo! Buzz
  • Google Bookmarks
  • Orkut
  • SphereIt
  • Sphinn

How to Quickly Clear All Text Formatting from PowerPoint Slides

Control Slide Formatting

Use SlideMaster to Control Formatting

One of my clients inherited a “Ransom Note” PowerPoint Presentation. I think that you can visualize what a “Ransom Note” slide looks like: Multiple Fonts at various sizes with multiple colors and effects thrown in for good measure! Ugly and, certainly, not professional.

Steps to Clear All Text Formatting

In my video tutorial, I demonstrate:

  • How to work in PowerPoint’s Outline View
  • How to use Keyboard Shortcuts to expand and collapse the text for each slide
  • How to clear all of the text formatting

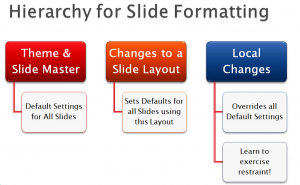
Use the SlideMaster to Set Default Settings for Text

In my experience, most of the people who use PowerPoint are either unaware of the SlideMaster or they do not know how to use it. In my tutorial, I demonstrate how Microsoft Office Themes and the SlideMaster work together to set the default setting for formatting your presentation.

Minimize Local Formatting

My goal, in creating this tutorial, is to impress upon you the importance of limiting your use of “local formatting.” The reason that “ransom note” formatting survives is a direct result of applying local formatting rather than using the SlideMaster to help you to maintain a consistent look.

Additional Resources for Learning PowerPoint

I am the author of the best-selling DVD-ROM, “The 50 Best Tips for PowerPoint 2007.Click on this link to learn more about the 7 1/2 hours of focused video training that I offer on my DVD-ROM.

Watch My Tutorial in High Definition

Follow this link to view my tutorial in High Definition on my YouTube Channel – DannyRocksExcels


Share and Enjoy:
  • Add to favorites
  • Facebook
  • Twitter
  • Technorati
  • Print
  • email
  • Digg
  • StumbleUpon
  • del.icio.us
  • Yahoo! Buzz
  • Google Bookmarks
  • Orkut
  • SphereIt
  • Sphinn

How to Use a Check Box to “Toggle” Conditional Formatting On or Off in Excel

Sort by Color in Excel

Sort by Color in Excel

In my previous Excel Tutorial – “Conditional Formatting to Dynamically Format Dates” – I demonstrated how to  apply Conditional  Formatting based upon the number of days have passed since last contact with a customer. Now I will extend what you just learned.

Three Techniques in this Video:

  1. How to extend  Conditional Formatting Rules to additional cell ranges.
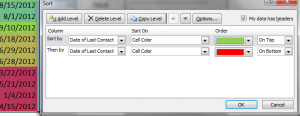
  2. How to use the “Sort by Colors” feature introduced in Excel 2007.
  3. How to add a Check Box Form Control that will “toggle” the Conditional Formatting On or Off.

Paste Special “Live Preview”

I demonstrate a great new feature introduced in Excel 2010, “Live Preview” for Paste Special. You will use Paste Special – Formats to extend the rules for Conditional Formatting to a new range of Cells

Sort by Color

Beginning with Excel 2007, you can now sort fields based upon the color of a font or a cell background. I show how this works.

The Check Box Form Control

The “key concept” to understand when using Excel’s Form Controls is the “Cell Link.” With a Check Box Control, the value in the Cell Link is TRUE when the box is “checked” while the value is FALSE when it is Unchecked. We can use this information to create a “Conditional Format based upon a Formula.”

Conditional Formatting Rules

When you base Conditional Formatting upon a Formula, the result of that formula must return TRUE in order apply this formatting. Setting the background cell color to “White” effectively “hides” the previous background cell colors.

Shop for The 50 Best Tips for Excel 2007

Shop for The 50 Best Tips for Excel 2007

Resources Offered for Sale

I encourage you to visit my secure online shopping website – http://shop.thecompanyrocks.com – to preview the many training resources that I offer you. Check out my latest Excel Training Videos:

Watch this Video in High Definition

Click on this link to watch this video in High Definition on my YouTube Channel – DannyRocksExcels


Share and Enjoy:
  • Add to favorites
  • Facebook
  • Twitter
  • Technorati
  • Print
  • email
  • Digg
  • StumbleUpon
  • del.icio.us
  • Yahoo! Buzz
  • Google Bookmarks
  • Orkut
  • SphereIt
  • Sphinn

How to Dynamically Color-Code Dates with Conditional Formatting in Excel

Conditional Formatting for Dates

Conditional Formatting for Dates

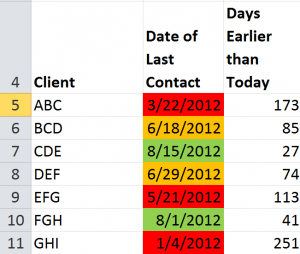
One of my viewers wants to learn how to “dynamically” color-code cells that contain dates. She is monitoring the frequency of contact with her clients and she wants Excel to automatically apply:

  • One background color to cells where it has been less than 60 days since last contact
  • A different color when the time frame is between 60 and 90 days
  • A third color when it has been over 90 days since the last contact with a client

Here, I demonstrate how she can do this using Conditional Formatting Rules. However, this will only work if you are using Excel 2007 or Excel 2010.

Understanding Dynamic Date Functions

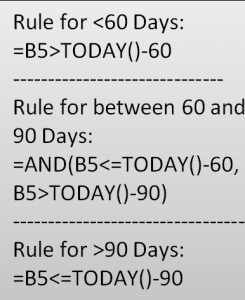
In order to make this visualization “dynamic,” I make references to cells that contain the =TODAY() Function. This is a “volatile” function that updates automatically based upon the date in your computer system’s clock. I use this to classify the last date of contact with her clients.

Improvements in Conditional Formatting

Beginning with Excel 2007, you can now apply multiple rules that use formulas. Remember that when you use a formula, it must evaluate as “TRUE” in order to apply the formatting that you specify.

Formulas Used to Apply Conditional Formatting

Conditional Formatting Rules

Rules for Conditional Formatting

To make it easier for you to practice this skill, I have posted this table that details the formulas that I used for each of the three rules in my video tutorial.Note that with the middle condition, I use the =AND() Function. All logical tests must answer TRUE for the AND() Function to return TRUE.

It will take a little bit of practice for you to become comfortable with these formulas. As a Best Practice, I recommend that you create a table of formulas so that you can see how a “tweak” in your formula can turn a FALSE answer into a TRUE answer.

Related Video

Follow this link to Part Two in this Series. I demonstrate how to “toggle” Conditional Formatting On or Off by using a Check Box Control in Excel.

Watch this Video in High Definition

Follow this link to watch my Excel Tutorial in High Definition on my YouTube Channel – DannyRocksExcels

Get the Best Tips and Training for Excel

Click on this link to learn more about my best-selling DVD-ROM, “The 50 Best Tips for Excel 2007.” This link will take you to my secure online shopping website –  http://shop.thecompanyrocks.com

Subscribe to my Video Podcast on iTunes

Here is the link to go to my free Video Podcast, “Danny Rocks Tips and Timesavers” on iTunes.


Share and Enjoy:
  • Add to favorites
  • Facebook
  • Twitter
  • Technorati
  • Print
  • email
  • Digg
  • StumbleUpon
  • del.icio.us
  • Yahoo! Buzz
  • Google Bookmarks
  • Orkut
  • SphereIt
  • Sphinn

How to Highlight Different Values in a Row with Excel’s Go To Special

Go To Special Dialog Box

Go To Special – Row Differences

I have published several video tutorials on the topic of Highlighting and Deleting Duplicate Records in Excel. However, a viewer recently asked me how to highlight cells that contain different values in the same Row. This is not as “crazy” as it first seems.

Scenario for this Tutorial

I am trying to determine accurate inventory counts for my product line. I have the count that the computer shows. I also have records from three different auditors who have performed manual counts. I need to easily highlight the cells where the inventory count “is off.” That is where there is a discrepancy between what the computer shows and what a manual count shows.

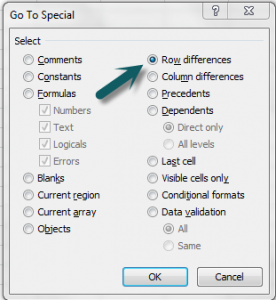
Go To Special Dialog Box

The commands in the Go To Special Dialog Box are some of my favorite tools. In my experience, I have found that most Excel users have never explored this dialog box.  I think that will change after you watch this video tutorial. For the Row Differences tool, you first select the range of cells that contain your data – beginning with the left-most column. The Row Differences will use this left-most column as the “baseline” and highlight each cell in that row that contains a value that is different from this baseline.

Sorting & Filtering by Color

Beginning with Excel 2007, you can Sort by Color and you can also Filter by Color. After the cells were highlighted with the Row Differences command, I applied a background cell color to each highlighted cell.

Use one of my favorite Keyboard Shortcuts, Ctrl + Shift + L, when working with Filters in Excel 2007 or Excel 2010.

Watch this Excel Tutorial in High Definition

You can watch this tutorial in High Definition on my YouTube Channel – DannyRocksExcels.  Click on this link to watch this video now.

Video Tutorials for Highlighting Duplicate Records

I mentioned that I have published many Excel Tutorials on the Topic of Highlighting & Removing Duplicate Records. Here are links to my tutorials:

Shop for Excel Training Resources

I invite you to visit my secure online shopping website – http://shop.thecompanyrocks.com – to examine and purchase the many training resources that I offer.

Watch My Video Podcasts on iTunes

Click on this link to watch my “Danny Rocks Tips and Timesavers” video podcast on iTunes. – It is free of charge!

 Note: The original Podcast Video did not have the correct video settings. This video has now been updated.


Share and Enjoy:
  • Add to favorites
  • Facebook
  • Twitter
  • Technorati
  • Print
  • email
  • Digg
  • StumbleUpon
  • del.icio.us
  • Yahoo! Buzz
  • Google Bookmarks
  • Orkut
  • SphereIt
  • Sphinn

How to Use Excel’s Histogram Tool and The 80/20 Rule of Analysis

Histogram Charts in Excel

Excel Histogram Charts

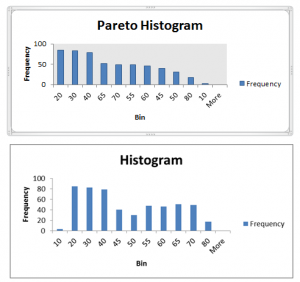
This is the Third – and final – episode in my “Creating Frequency Distribution Reports in Excel” series of tutorials.  In this episode, I demonstrate a very powerful – and very easy to use – analysis tool – The Histogram Tool.

Excel’s Analysis ToolPak “Add-in”

This tool is included in the Analysis ToolPak which is an “Add-in” program within Excel. Beginning with Excel 2007, the Analysis ToolPak is automatically included in a basic installation of Excel. However, if you are using an earlier version of Excel or if, somehow, this Add-in has been disabled, I show you how to “activate it.”

Advantages of Using Excel’s Histogram Tool

  • No Formulas to write
  • Results are Numeric Values – not Formulas
  • Chart(s) can be added automatically
  • Multiple Chart Options
  • Pareto Chart Option

What is a Pareto Chart?

Pareto Analysis is commonly known as “The 80 / 20 Rule.” A brief explanation is: Roughly 80% of your sales come from only 20% of your customers or 20% of your products. I like to say, “You can focus on the Vital Few and not on the Trivial Many,” when you use Pareto Charts. As you will see in my video, when you choose the Pareto Chart option, the Histogram automatically sorts the Frequency Field in descending order and charts this field.

Links to All Videos in Frequency Report Series

Improve your Excel Skills – My Video Tutorials

I invite you to visit my secure online shopping website to see the many training resources that I offer. For example, click here to learn about my best-selling DVD-ROM, “The 50 Best Tips for Excel 2007.”

Follow The Company Rocks on Facebook

You can now follow me on Facebook – www.facebook.com/TheCompanyRocks


Share and Enjoy:
  • Add to favorites
  • Facebook
  • Twitter
  • Technorati
  • Print
  • email
  • Digg
  • StumbleUpon
  • del.icio.us
  • Yahoo! Buzz
  • Google Bookmarks
  • Orkut
  • SphereIt
  • Sphinn

How to Group People by Age Bracket Using an Excel Pivot Table

Pivot Table for Age Brackets

Pivot Table to Group Age Brackets

In my previous Excel Tutorial, I demonstrated how to use the Group Field command in a Pivot Table to summarize time periods by the Hour. Several viewers wanted to know what other grouping possibilities are available in Pivot Tables. One viewer wanted to know how to group people who responded to a survey by Age Brackets. That is why I created this tutorial!

Use DATEDIF Function to Calculate Age

From my perspective, the DATEDIF() is an invaluable function. However, it is not documented in Excel. Watch how I use its three arguments to calculate the age of each person in the data set.

Group Field by Age

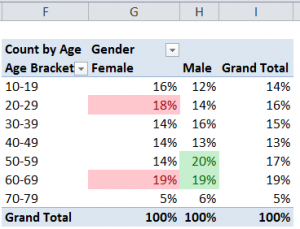
Select a single value in the “Age” Field and then select the “Group Field” Command. In the dialog box, choose the “step-value” for your groups. In this case, I chose the Default Setting of 10 years.

Show Pivot Table Values As

Some of the most powerful Pivot Table tools are found on the “Show Values As” tab of the “Value Field Settings” Dialog Box. Watch me demonstrate how to show each Age Bracket as a Percentage of the Column.

Apply Conditional Formatting to Pivot Table

Take advantage of the greatly improved Conditional Formatting Commands in Excel 2007 and Excel 2010 to focus attention on the key information in your Pivot Table. In this case, I use the “Top 10 Items” rule to apply Conditional Formatting to the two highest Age Brackets- by percentage – for each gender.

Learn Excel Pivot Tables Quickly

Follow this link to learn about the focused 90 minute video tutorials that I have published to help you to really learn how to get the most out of Pivot Tables. Available in versions for Excel 2003, Excel 2007, and Excel 2010.

Watch Tutorial in High Definition

Click on this link to watch this Excel Tutorial in High Definition on my YouTube Channel – DannyRocksExcels


Share and Enjoy:
  • Add to favorites
  • Facebook
  • Twitter
  • Technorati
  • Print
  • email
  • Digg
  • StumbleUpon
  • del.icio.us
  • Yahoo! Buzz
  • Google Bookmarks
  • Orkut
  • SphereIt
  • Sphinn

How to Group an Excel Pivot Table Field to Summarize By Hours

Pivot Table Summary Report By Hour

Pivot Table Summary Report By Hour

After viewing my previous video tutorial, one of my subscribers asked me to demonstrate how to actually summarize a minute-by-minute Excel report into an hour-by-hour report.

My viewer was unfamiliar with Pivot Tables – as are many Excel users – so I created this video to show him – and you how to do this.

Group a Pivot Table Field

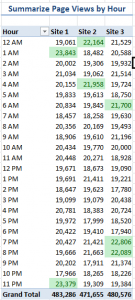
Begin by right-clicking a single cell in the Time Field and choosing Group Field. In the dialog box, deselect Month and choose Hour. That’s it – it’s that simple!

Apply Conditional Formatting to the Top 10%

Beginning with Excel 2007, Conditional Formatting has been tremendously improved. Watch how I apply a “Top 10%” Conditional Format Rule with three mouse clicks!

Purchase My 90 Minute Focused Pivot Table Tutorial

Whether you are a novice or an experienced user of Excel Pivot Tables, you will learn some great Tips and Techniques when you purchase my 90 minute video tutorial: “Summarize, Analyze and Present Information with Excel Pivot Tables.”

Follow this link to learn more about my video tutorial for Pivot Tables. Available for ALL versions of Excel as either a DVD-ROM or as a Downloadable Product.

Watch Video Tutorial in High Definition

Click on this link to watch this Excel Video Tutorial in High Definition on my YouTube Channel – DannyRocksExcels


Share and Enjoy:
  • Add to favorites
  • Facebook
  • Twitter
  • Technorati
  • Print
  • email
  • Digg
  • StumbleUpon
  • del.icio.us
  • Yahoo! Buzz
  • Google Bookmarks
  • Orkut
  • SphereIt
  • Sphinn

How to Calculate the Calendar Year Quarter for a Date in Excel

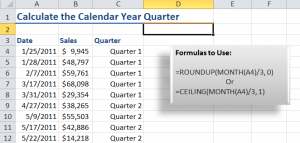
Formulas to Calculate a Calendar Year Quarter

Formulas to Calculate a Calendar Year Quarter

After watching my previous video tutorial, “How to Place Dates in a Fiscal Year Quarter,” several viewers requested that I demonstrate how to calculate the calendar year quarter for a date.

This requires “nesting” the MONTH() /3 Function inside either the ROUNDUP() or the CEILING() Function. I break these formulas down step-by-step in this video so that you can see how they work.

Formatting Numbers to Include Text

As a bonus, I demonstrate how to format the formula result cells to include the text “Quarter.” This is really simple to create as a custom format.

Download this Video Podcast from iTunes

You can watch and download this – and many of my – video tutorials for free at iTunes. Here is the link to my iTunes video podcast, “Danny Rocks Tips and Timesavers.”

Watch Video in High Definition

Follow this link to watch this Excel Tutorial in High Definition on my YouTube Channel – DannyRocksExcels

Visit my Secure Online Shopping Website

I invite you to visit my online shopping site – http://shop.thecompanyrocks.com – to preview and purchase my training resources. I guarantee your satisfaction 100%. I will refund your purchase if, for any reason, you are not satisfied with my products!


Share and Enjoy:
  • Add to favorites
  • Facebook
  • Twitter
  • Technorati
  • Print
  • email
  • Digg
  • StumbleUpon
  • del.icio.us
  • Yahoo! Buzz
  • Google Bookmarks
  • Orkut
  • SphereIt
  • Sphinn

Microsoft Access – A Quick Video Tour of my DVD, The 50 Best Tips for Access 2007

Microsoft Access and Microsoft Excel work together seamlessly. However, they are VERY DIFFERENT programs. It is very easy to exchange data between the two programs. But there is a world of difference when in it comes to storing, entering, and analyzing data in each program.

Recently, a number of my viewers have asked me how to create Data Forms in Excel. In almost every case, they want a simple answer – one that does not require them to learn VBA – Visual Basic for Applications. My considered response is that Access is the best way to collect and relate data via Forms. And then, use Excel to analyze the information that you collect from those data forms.

Here is a short – 6 1/2 minutes –  video tour of my DVD-ROM, “The 50 Best Tips for Access 2007.” If you have never used Microsoft Access, this video will give you an idea of how it works. If you have tried to use Access, but gave up in frustration, I am confident that my video tutorials will help you to get over the learning curve so that you can use Access to its full potential!

Nine Categories of  Video Tutorials for Access 2007

On my DVD-ROM, I have organized the 50 Video Tips into nine categories of lessons:

  1. Getting Started with Access 2007 – 9 Videos. Perfect introduction for new users of Access as well as a quick guide the the changes and additions in Access 2007 and Access 2010.
  2. Working with Tables in Access 2007 – 5 Videos. Tables are the essential building blocks in Access. Learn how to create many focused Tables and then create relationships between them.
  3. Using Filters & Queries in Access 2007 – 8 Videos. Filters are “temporary” or one-time questions. Queries are “saved” or “named” questions about the information in your database.
  4. Running Action Queries in Access  2007 – 4 Videos. Action queries allow you to quickly make changes to the data in Access. You can update, or delete records; append records or make a new table from a query.
  5. Working with Access 2007 Forms – 9 Videos. Forms are very easy to create in Excel. Use forms to enter data or to view your data – one record at a time. Gather data via Forms in Access and then export this data to analyze in Excel.
  6. Working with External Data in Access 2007 – 4 Videos. Did you know that you can use Access to semi-automatically update your Microsoft Outlook contact information? Learn how to integrate the programs in the MS Office Suite.
  7. Working with Access 2007 Reports – 5 Videos. Reports are designed for printing and distributing the summarized information in you Access database. Learn how to create a mailing label report for your next direct mail campaign!
  8. Managing Access 2007 Databases – 3 Videos. Learn how easy it is to back up your database. You can even “split” a larger database into smaller, more focused databases.
  9. Automating Access 2007 – 3 Videos. Learn how to use Macros and Command Buttons that allow less-experienced end-users enter and output the information in your Access database.

Table of Contents for “The 50 Best Tips for Access 2007.”

Click here to see specific data – including run times – for each of the 50 video lessons on my DVD-ROM.

Purchase my DVD-ROM – “The 50 Best Tips for Access 2007”

To learn more about my DVD-ROM, I invite you to visit my secure online shopping website – http://shop.thecompanyrocks.com I guarantee your satisfaction 100%. If you are not satisfied with any of my products, you may return them – without questions – at any time!

Watch Video in High Definition

Follow this link to watch this video lesson in High Definition – on my YouTube Channel, DannyRocksExcels
 

Share and Enjoy:
  • Add to favorites
  • Facebook
  • Twitter
  • Technorati
  • Print
  • email
  • Digg
  • StumbleUpon
  • del.icio.us
  • Yahoo! Buzz
  • Google Bookmarks
  • Orkut
  • SphereIt
  • Sphinn