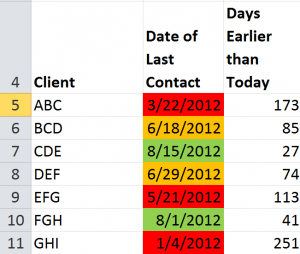
One of my viewers wants to learn how to “dynamically” color-code cells that contain dates. She is monitoring the frequency of contact with her clients and she wants Excel to automatically apply:
- One background color to cells where it has been less than 60 days since last contact
- A different color when the time frame is between 60 and 90 days
- A third color when it has been over 90 days since the last contact with a client
Here, I demonstrate how she can do this using Conditional Formatting Rules. However, this will only work if you are using Excel 2007 or Excel 2010.
Understanding Dynamic Date Functions
In order to make this visualization “dynamic,” I make references to cells that contain the =TODAY() Function. This is a “volatile” function that updates automatically based upon the date in your computer system’s clock. I use this to classify the last date of contact with her clients.
Improvements in Conditional Formatting
Beginning with Excel 2007, you can now apply multiple rules that use formulas. Remember that when you use a formula, it must evaluate as “TRUE” in order to apply the formatting that you specify.
Formulas Used to Apply Conditional Formatting
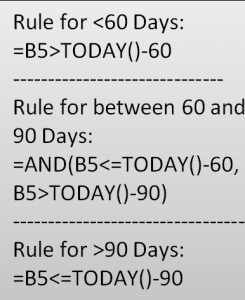
To make it easier for you to practice this skill, I have posted this table that details the formulas that I used for each of the three rules in my video tutorial.Note that with the middle condition, I use the =AND() Function. All logical tests must answer TRUE for the AND() Function to return TRUE.
It will take a little bit of practice for you to become comfortable with these formulas. As a Best Practice, I recommend that you create a table of formulas so that you can see how a “tweak” in your formula can turn a FALSE answer into a TRUE answer.
Related Video
Follow this link to Part Two in this Series. I demonstrate how to “toggle” Conditional Formatting On or Off by using a Check Box Control in Excel.
Watch this Video in High Definition
Follow this link to watch my Excel Tutorial in High Definition on my YouTube Channel – DannyRocksExcels
Get the Best Tips and Training for Excel
Click on this link to learn more about my best-selling DVD-ROM, “The 50 Best Tips for Excel 2007.” This link will take you to my secure online shopping website – http://shop.thecompanyrocks.com
Subscribe to my Video Podcast on iTunes
Here is the link to go to my free Video Podcast, “Danny Rocks Tips and Timesavers” on iTunes.
 How to use Conditional Formatting to Color-Code Dates in Excel [ 8:49 ] Play Now | Play in Popup | Download (3143)


