Working With Array Formulas in Excel

There are at least two benefits to using an Array Formula in Excel:

  1. They will speed up creating your formulas by, in many cases, eliminating intermediate formulas.
  2. They will add a level of protection to your formulas because you cannot edit the individual cells in an Array Formula. You must edit “all” of the cells.
Array Formulas
Array Formulas

In this lesson, I first demonstrate how to select and use arrays with the SUMPRODUCT() Function in Excel. SUMPRODUCT is a very handy function to use when you want to first multiply (PRODUCT) the cells in two or more arrays and then total (SUM) the results.

 
Next, I demonstrate two ways to create Array Formulas. Notice that in the second example that it is important that you remember to select ALL of the cells that will contain the results of the Array Formula. It is vital that all arrays are of Equal Size (Same number of cells in the same dimension – horizontal and vertical).
 

Entering Array Formulas

Use the keyboard combination of Ctrl + Shift + Enter when entering an Array Formula. Do not press the Enter key alone – this will result in an Error for your formula! Some people refer to Array Formulas as CSE Formulas to remember the Ctrl + Shift + Enter combination. Notice, in the Formula Bar,  that Excel automatically adds { braces } around the Array Formula. Do not enter these manually.

Editing Array Formulas

You gain a level of protection for your formulas when you use Array Formulas because you cannot select a single formula cell to edit it. You must select all of the cells that contain the Array Formula before you can edit it – or delete it. If you don’t select all of the cells first, you receive an Error message in a pop-up window. Remember to press the “CSE keyboard combination” when you complete your edit of the Array Formula.

Learning to use Array Formulas is an essential skill to acquire if you want to master Excel. I guarantee that you will be able to write more accurate formulas when you use arrays.

Watch this Video on YouTube

Click this link to watch this Excel Video in High Definition, Full Screen Mode on my YouTube Channel – DannyRocksExcels

Learn how to “Master Excel in Minutes – Not Months!”
Share and Enjoy:
  • Add to favorites
  • Facebook
  • Twitter
  • Technorati
  • Print
  • email
  • Digg
  • StumbleUpon
  • del.icio.us
  • Yahoo! Buzz
  • Google Bookmarks
  • Orkut
  • SphereIt
  • Sphinn

How to Use Conditional Formatting to Compare Two Excel Lists

Clients and viewers frequently ask me to help them to compare two differeny lists in Excel. They want to find – or highlight – the values that are different in each list. For example, which customers appear in the 1st list but NOT in the 2nd list. So, I created this video lesson to demonstrate how to do this with Conditional Formatting.

In an earlier Excel Video Lesson, I demonstrated how to compare two Excel lists using either the MATCH() Function or the VLOOKUP() Function.

Conditional Formatting Rule

Conditional Formatting Rule

Use Conditional Formatting

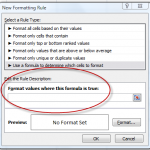
I demonstrate how to use Conditional Formatting to Highlight the Cell Values that are different when you compare two Excel Lists. I will use a “New Rule with a Formula” that must return the answer TRUE, to trigger the special formatting.

In Conditional Formatting, you first establish a “condition” that can be answered as either TRUE or FALSE. Then, for those cells where the answer to the condition is TRUE. the special “cell formatting” that you chose will apply.

In this lesson we will be using this Formula: =COUNTIF(List 2, 1st cell in List 1) = 0.

Steps to follow:

  1. Select the cells that you want the Conditional Formatting to apply to- in our example List 1.
  2. On the Home Tab of the Ribbon, click the Conditional Formatting arrow and select New Rule.
  3. Select New Rule – “Use a Formula to determine which cells to format.”
  4. Enter the formula – e.g. =COUNTIF(Range, Criteria) = 0 where the “Range” is the list of values in List 2 (Absolute Reference) and the “Criteria” is the 1st cell reference in List 1 (Relative Reference).
  5. Choose the Format for the cells when the condition is met – the result is TRUE. In this example, I choose to “FILL” the cells with a Blue background color.

Want to watch this video in High Definition, Full-Screen Mode? Click here to go to my YouTube Channel, DannyRocksExcels

Learn to “Master Excel in Minutes – Not Months!”

Share and Enjoy:
  • Add to favorites
  • Facebook
  • Twitter
  • Technorati
  • Print
  • email
  • Digg
  • StumbleUpon
  • del.icio.us
  • Yahoo! Buzz
  • Google Bookmarks
  • Orkut
  • SphereIt
  • Sphinn

How to Add Scroll Bar Controls to Excel Forms

This is the fourth in my continuing series of Excel training video lessons on Adding Form Controls to your worksheets. Here, I demonstrate how to Add Scroll Bar Controls to a Loan Scenario. Form Controls help to make your Excel worksheets “interactive,” and they are great tools to add when you distribute spreadsheets to users who may not be proficient in Excel.

Understand the Cell Link

The key concept to understand with Form Controls is the “Cell Link.” The form controls are merely “drawing shapes” until you actually link them to a cell that controls their output. The “got’cha” step for Scroll Bars – as with Spin Buttons – is that the Maximum Value is 30,000. So, if you want a control to show a loan amount of, for example, $300,000.00 you make the Maximum value 300 and then create a formula that references the “cell link” and multiplies it by 1,000.

In my research on Form Controls, I rarely find authors who mention this point – and, in my experience, this is how most Excel users get “tripped up” when they want to add Form Controls to workbooks to make them interactive. Watch as I walk you through each step in this process.

Please, let me know if this video lesson has helped you to better understand how Excel Form Controls work. Add your comment below – I promise to respond to your comments!

Danny

You can click on this link to view the other videos in my series on Form Controls in Excel.

Learn how to “Master Excel in Minutes – Not Months!”

Share and Enjoy:
  • Add to favorites
  • Facebook
  • Twitter
  • Technorati
  • Print
  • email
  • Digg
  • StumbleUpon
  • del.icio.us
  • Yahoo! Buzz
  • Google Bookmarks
  • Orkut
  • SphereIt
  • Sphinn

Use an Excel Data Table to See Effect on Multiple Formulas

Excel Data Tables are part of the “What-if” Analysis group of tools and commands. In this lesson, I demonstrate how to use a one-input Data Table to show how substituting a series of inputs effects three separate formulas. This is a powerful – and easy – way to get answers to a series of “What-if” questions.

Data Table

2-Input Data Table

Two-Input Data Table

I know that as I learned how to construct Data Tables, it was a lot easier for me to “see” how to set them up rather than to “read about” how they are set up. You can put your series of substitute values in either the “Column running down” or the “row going across” in the data table. To include the three formulas in the Data Table, I simply included “Links” to the formulas in the original assumptions table.

Learn More About “What-if Analysis Tools in Excel

I have identified “What-if” Analysis as one of my “Nine Essential Skills for Excel.” You can learn more about my 4 hour video tutorial package by clicking on either of these links:


Share and Enjoy:
  • Add to favorites
  • Facebook
  • Twitter
  • Technorati
  • Print
  • email
  • Digg
  • StumbleUpon
  • del.icio.us
  • Yahoo! Buzz
  • Google Bookmarks
  • Orkut
  • SphereIt
  • Sphinn

Two Ways to Create a Frequency Distribution in Excel

What is a “Frequency Distribution?” A good example is to see how frequently daily sales are “under $75.00” or how often they range “between $75.00 and $150.00.” Once you know how frequently a result occurs, you can better focus your attention on that particular segment of your business.

In this short 5 minute and 45 second Excel Training Video Lesson, I demonstrate two approaches to creating a Frequency Distribution Report:

  1. Use the =FREQUENCY() Function – this is an ARRAY Function.
  2. In a Pivot Table, Group the Row Labels to produce a Frequency Distribution.

An ARRAY Function has two “Got’cha steps:”

  1. Select all of the cells that will contain the results before your enter your Array Formula.
  2. Use the Ctrl + Shift + Enter keyboard combination to enter your Array Formula.

You can watch this video here on my website, you can download it via an RSS Feed or you can watch it as a Podcast at the iTunes Store.

Learn how to “Master Excel in Minutes – Not Months!”

Share and Enjoy:
  • Add to favorites
  • Facebook
  • Twitter
  • Technorati
  • Print
  • email
  • Digg
  • StumbleUpon
  • del.icio.us
  • Yahoo! Buzz
  • Google Bookmarks
  • Orkut
  • SphereIt
  • Sphinn

How to Use an Excel Data Table for “What-if” Analysis

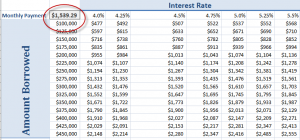
Excel has many tools that give you answers to “What-if” questions. An Excel Data Table allows you to feed a series of “substitute values” into two arguments in a formula. For example, with a Data Table you can:

  • See a table of monthly payments on a loan by substituting both the “Interest Rate” and the “Amount Borrowed” simultaneously.
  • See a table of “Net Payments” by changing both the “Sales Price” and the “Quantity” simultaneously.
  • See the amount that you “tip” a service professional by changing both the “Tip Percentage” and the “Food Total” simultaneously.

As you will see in this Excel Video Lesson, the trick is to understand which series of values are the “Row Inputs” and which series of substitute values are the “Column Inputs.”

Trust me on this: It is easier to “see” how to set up a Data Table than it is to “write a description” of a Data Table. So, I invite you to “see for yourself” how easy it is to set up an Excel Data Table and get answers to two simultaneous “What-if” questions!

Click here to see a Listing of “The 50 Best Tips for Excel 2007.”

Learn how to “Master Excel in Minutes – Not Months!”

Share and Enjoy:
  • Add to favorites
  • Facebook
  • Twitter
  • Technorati
  • Print
  • email
  • Digg
  • StumbleUpon
  • del.icio.us
  • Yahoo! Buzz
  • Google Bookmarks
  • Orkut
  • SphereIt
  • Sphinn

When to Use Absolute, Relative & Mixed Cell References in Formulas

In my experience, I find that many Excel users get easily confused when it comes time to use an Absolute or a Mixed Cell Reference in a formula. Let me demonstrate how and when to use the proper cell references, so that you always get the correct result.

Here is what each type of cell reference looks like in a formula:

  • Relative Cell Reference – =A2*B2 when copied down one row becomes = A3*B3
  • Absolute Cell Reference – =A2*$B$2 when copied down one row becomes =A3*$B$2 (Notice the $B$2 Absolute cell reference in the formula)
  • Mixed Cell Reference – =$A2*B$3 when copied down one row becomes = $A3*B$3 and when copied one cell to the right becomes =$A*C$3 (Notice how one part of the cell reference is relative – it moves; and the other part of the reference is Absolute – it remains fixed in place)

Learn how to “Master Excel in Minutes – Not Months!”

Share and Enjoy:
  • Add to favorites
  • Facebook
  • Twitter
  • Technorati
  • Print
  • email
  • Digg
  • StumbleUpon
  • del.icio.us
  • Yahoo! Buzz
  • Google Bookmarks
  • Orkut
  • SphereIt
  • Sphinn

Quickly Fill In all Blank Cells in Excel Report

Frequently clients will show me a report that they have downloaded from a Main Frame Computer or a Database Report. The report contains multiple blank cells. In order for my client to insert a Pivot Table or to perform Subtotals, they must fill in the blank cells by copying the value for the cell above. I have watched, in amazement, as clients copy and paste – or even type in – the missing values. There is an efficient way to perform this task. Here are the Excel Concepts that I cover in this short – 3 minute – Excel video training lesson:

  • Go To Special – Current Range
  • Go To Special – Blank Cells
  • Use Ctrl + Enter to register the formula into each cell in the selected range
  • Copy, Paste Special Values to convert formulas to values

This tip will save you lots and lots of time and prevent careless data entries. If you like this tip, I have 50 similar tips to offer you on my DVD, “The 50 Best Tips for Excel 2007.” Click here to add my DVD to your Shopping Cart.

Learn how you can “Master Excel in Minutes – Not Months!”

Share and Enjoy:
  • Add to favorites
  • Facebook
  • Twitter
  • Technorati
  • Print
  • email
  • Digg
  • StumbleUpon
  • del.icio.us
  • Yahoo! Buzz
  • Google Bookmarks
  • Orkut
  • SphereIt
  • Sphinn

Perform Break Even Analysis with Excel’s Goal Seek Tool

As a small business owner or investor, you ask many“what-if?” questions. In preparing to present your business plan to an investor you want to know your “break even” point. Fortunately, Excel has a great tool – Goal Seek – that can save you time by creating multiple scenarios to help you determine your goal – to break even!

You can watch this Excel Video Lesson here – online – or you can download it to watch later, at your convenience. I invite you to subscribe to my podcast, Danny Rocks Tips and Timesavers” at the iTunes store by clicking this link – this is a free subscription.

Click here to see a listing of “The 50 Best Tips for Excel 2007.”

Learn how you can “Master Excel in Minutes – Not Months!”

Share and Enjoy:
  • Add to favorites
  • Facebook
  • Twitter
  • Technorati
  • Print
  • email
  • Digg
  • StumbleUpon
  • del.icio.us
  • Yahoo! Buzz
  • Google Bookmarks
  • Orkut
  • SphereIt
  • Sphinn

Use Excel’s Goal Seek to Find Formula Error

A viewer wrote me seeking help with a formula. He was calculating a monthly payment for a loan using Excel’s PMT() Function and he was surprised at the result of the formula. I reviewed his formula and discovered that it was not a “formula problem.” Rather, it was a “results problem!” Watch this short video to see how I solved this problem for my viewer by using Excel’s “Goal Seek” tool. So now, instead of a monthly payment of $10,666.67, the result is $501.38 – a very different result!

You can download this video – for free – here on my website. Just click the button below the video image.

You can also subscribe to my Podcast, “Danny Rocks Tips and Timesavers” at the iTunes Store.

You can “Master Excel in Minutes – Not Months!”

Share and Enjoy:
  • Add to favorites
  • Facebook
  • Twitter
  • Technorati
  • Print
  • email
  • Digg
  • StumbleUpon
  • del.icio.us
  • Yahoo! Buzz
  • Google Bookmarks
  • Orkut
  • SphereIt
  • Sphinn