View My Excel Training Videos on YouTube

DannyRocksExcels on YouTube

YouTube

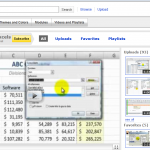
Two years ago, in August 2010, I started uploading my Excel video training lessons to my YouTube Channel – DannyRocksExcels. Now there are 93 Excel videos available. I was originally reluctant to post my video content on YouTube because I selfishly wanted to restrict my videos to my own website. After a conversation with a colleague, I changed my mind and began to upload all of my Excel videos to YouTube.
Why?
  • YouTube attracts a much more diverse audience than I could ever hope to attract on this website.
  • YouTube makes it easy to download and share my videos with others.
  • YouTube has a great analytics program – Insight – that allows me to gain valuable information about my audience.
  • YouTube is now showing several of my most popular videos as ads automatically (via Google AdSense)
  • I have good interaction with my viewers on YouTube – comments, requests for new videos, etc.

When I look at the numbers on YouTube I am amazed!

Here is a summary:

  • My Excel Videos have been viewed almost 200,000 times over the past two years.
  • One Video (Introduction to Pivot Tables) has been viewed over 20,000 times!
  • My DannyRocksExcels Channel on YouTube now has over 500 subscribers.

I invite you to view, download or subscribe to my YouTube Channel for Excel Training videos by following this link.

Thank you!

Danny Rocks

P.S. Learn how to “Master Excel in Minutes – Not Months!”
Share and Enjoy:
  • Add to favorites
  • Facebook
  • Twitter
  • Technorati
  • Print
  • email
  • Digg
  • StumbleUpon
  • del.icio.us
  • Yahoo! Buzz
  • Google Bookmarks
  • Orkut
  • SphereIt
  • Sphinn

How to Save Hours Updating Pivot Tables in Excel 2007

This Excel 2007 Training Video could – conservatively – save you at least one hour each month when you need to update your Pivot Tables!

What is that worth to you and your company? $100.00? $500.00? – Multiply that by 12 for each month in the year…

Have I got your attention yet?

Watch this short – 3 minute and 20 second video lesson – and you can thank me – or learn more ways to save time and money by purchasing my DVD – “The 50 Best Tips for Excel 2007”

If you watched this short – 3 minute 20 second video lesson, you can tell that I am excited about this topic. Would you like to trade 3 1/2 minutes to watch this video in order to save hundreds of $$$ each month to get an updated Pivot Table?  If your answer is anything other than “Yes!”, please send me an email – I would like to know what I am missing.”

Enjoy this video – and enjoy spending or investing the savings that you reap each month by applying this technique!

Want to save even more money? – Purchase my DVD – “The 50 Best Tips for Excel 2007″ – Click here to shop at my secure website.

Want to find a specific – and FREE – Excel Video Training Lesson? Click here to visit my Index of Excel Video Training Lessons.

You can watch this Excel video on YouTube. I have almost 200 videos on my YouTube channel – DannyRocksExcels

Learn how to “Quickly Create Pivot Tables” in Excel

Share and Enjoy:
  • Add to favorites
  • Facebook
  • Twitter
  • Technorati
  • Print
  • email
  • Digg
  • StumbleUpon
  • del.icio.us
  • Yahoo! Buzz
  • Google Bookmarks
  • Orkut
  • SphereIt
  • Sphinn

I Have Updated My Index of Excel Video Lessons

As part of the process of reorganizing my website, I have updated my “Index of Excel Video Lessons” page. The content of this page will be updated as I add each new Excel Video Training Lesson. So, I suggest that you click here to go to the Video Index and then save the page as one of your “Favorites” if you want to learn how to really get the most out of Excel or to find a quick answer when you are using Excel.

On the Index Page you can see an organized listing of my Excel Videos by Category – e.g. Formulas, Formatting, Pivot Tables “What-if” Analysis, etc. Each lesson is “hyperlinked” so that you can just click on the topic to go directly to the lesson that you are interested in.

I indicate in the title if the lesson is specific to Excel 2007.  All my new Excel video lessons are created using Excel 2007.

If there is a topic that you would like me to cover, send me an e-mail message – danny@thecompanyrocks.com

If you enjoy my video instruction, I encourage you to purchase my DVD, “The 50 Best Tips for Excel 2007.” The DVD contains over 5 1/2 hours of Tips, Tricks & Techniques to help you to master the program – and to save a considerable amount of time while working in Excel! Click here to enter my secure shopping site.

Thank you for your support and encouragement!

Danny Rocks

Share and Enjoy:
  • Add to favorites
  • Facebook
  • Twitter
  • Technorati
  • Print
  • email
  • Digg
  • StumbleUpon
  • del.icio.us
  • Yahoo! Buzz
  • Google Bookmarks
  • Orkut
  • SphereIt
  • Sphinn

How to Combine Changes Made to Multiple Excel Workbooks

Review Changes Command

Review Changes Commands

Frequently, several people work on an Excel 2007 Workbook. Perhaps to create departmental budgets or to analyze regional sales results. When it is time to combine the work of these individuals into the Master Excel Workbook you do not want to resort to “copy & paste!” Fortunately, you do not have to. Use Excel 2007’s Compare and Merge Tool to do this for us.

However, in order to make this work there are several “gotcha steps” to be aware of. Watch this video lesson to see how to combine the individual work of three colleagues into a “merged workbook” for an upcoming event. I guarantee that this lesson will save you time and aggravation at “budget time” each year.

Subscribe to My Video Podcast on iTunes

This video is available to view and download – for free – as a Podcast at the iTunes store. Click here to go to the Danny Rocks Tips and Timesavers Podcast at iTunes.

(Follow this link to watch this Video Podcast from my website.)

Visit My Secure Online Shopping Website

Watch My Tutorial Now

Visit My Secure Online Shopping Website

If you enjoyed this Excel video lesson, I invite you to visit my online store to purchase my DVD, “The 50 Best Tips for Excel 2007.” It contains over 5 1/2 hours of focused video instruction in Excel 2007 Tips, Tricks & Techniques. Click here to shop using a secure shopping cart.


Related Excel Video Lessons:

Watch this Excel Tutorial in High Definition

Do you want to watch this Excel Video Lesson on YouTube? Follow this link to view it on my YouTube channel, DannyRocksExcels

Note: As of September 2012, this video has been viewed over 79,000 times on YouTube!

Share and Enjoy:
  • Add to favorites
  • Facebook
  • Twitter
  • Technorati
  • Print
  • email
  • Digg
  • StumbleUpon
  • del.icio.us
  • Yahoo! Buzz
  • Google Bookmarks
  • Orkut
  • SphereIt
  • Sphinn

How to Create a Fiscal Year Summary Pivot Table Report in Excel 2007

This video lesson is related to my previous lesson – “How to Create a Month, Quarter Year Pivot Table Report.” This time, we are using a Fiscal Year.

I get asked this question frequently. So watch to see how this is done. One hint – your data source must include two fields that contain the Fiscal Year and the FY Quarter.

You can view and download the Excel video lesson – for free – as a Podcast. Click here to go to my Podcast, Danny Rocks Tips and Timesavers, at the iTunes store.

If you enjoyed this video, I invite you to shop at my secure online bookstore – http://shop.thecompanyrocks.com – You can purchase my DVD s in the series, “The 50 Best Tips for …”

Watch this Excel Video Lesson on YouTube

Related Excel Video Lessons:

Share and Enjoy:
  • Add to favorites
  • Facebook
  • Twitter
  • Technorati
  • Print
  • email
  • Digg
  • StumbleUpon
  • del.icio.us
  • Yahoo! Buzz
  • Google Bookmarks
  • Orkut
  • SphereIt
  • Sphinn

How to Create a Month, Quarter, Year Pivot Table Report in Excel 2007

Would you believe that with fewer than 10 mouse clicks you can transform a long list of daily sales transactions into a useful summary report – showing sales by Month, Quarter & Year?

Yes, you can do this with a Pivot Table report in Excel 2007 – using @ 10 mouse clicks.

Watch how I do this.

Now, many people will want to know how to customize this report to show Quarters that follow a Fiscal Year (e.g. April, May, June is FY Quarter 1) I demonstrate how to do this in my next lesson. Click here to view that video lesson.

If you liked this video, I invite you to shop for my DVD, “The 50 Best Tips for Excel 2007.” I have a secure shopping cart here on my website. Shop now!

Click here to watch this Excel Video Lesson on YouTube

Related Excel Video Lessons:

Share and Enjoy:
  • Add to favorites
  • Facebook
  • Twitter
  • Technorati
  • Print
  • email
  • Digg
  • StumbleUpon
  • del.icio.us
  • Yahoo! Buzz
  • Google Bookmarks
  • Orkut
  • SphereIt
  • Sphinn

Use the =COUNTIF() Function to see how many badges have been claimed

A viewer wants to know how many badges have been claimed and how many have not yet been claimed. In Excel, use the =COUNTIF() Function to get the answer(s) to this question.

If you have ever struggled with using “Nested =IF() functions” you will welcome the =COUNTIF() Function – it is so much easier to use because the arguments for the function follow a logical progression.

My viewer also wanted to see the names of the guests who have claimed or who have not yet claimed their badges. To answer this request, I use a Data Filter – very easy to use and change.

Learn Excel quickly. Over 5 1/2 hours of Excel 2007 training on my DVD. Each lesson averages @ 6 minutes.

Shop for the DVDs in “The 50 Best Tips for…” series at my online bookstore.

Share and Enjoy:
  • Add to favorites
  • Facebook
  • Twitter
  • Technorati
  • Print
  • email
  • Digg
  • StumbleUpon
  • del.icio.us
  • Yahoo! Buzz
  • Google Bookmarks
  • Orkut
  • SphereIt
  • Sphinn

How to Create Scenarios in Excel

Scenarios are part of Excel’s “What-If” Analysis tool set – aka Data Analysis. Use Scenarios when you need to know what the result will be when you change one or more variables in one or more  situations (scenarios).

Frequently, I create Scenarios to define  a “Good, Better, Best” or “Worst Case, Best Case, Case Most Likely” outcome.

In this short Excel Training Video, I demonstrate how to create, edit,  and report four Scenarios for a Monthly Office Expense Budget.

These are the steps used in this Excel Video Lesson:

  • Create (or open) an Excel worksheet that contains a formula. Identify the formula and the precedent  cells that feed into the formula.
  • Select the “target cell” – the cell that contains the formula whose result will change with each Scenario.
  • Choose TOOLS – SCENARIOS and follow the directions in the Create Scenario dialog box.
  • First, click ADD. Name the Scenario. Click OK. Confirm that you have selected the “Target Cell” and then click / type in the “Changing cells.” The Changing cells should be either direct or indirect precedents to the Target cell formula. Click Add. Add additional Scenarios as desired.
  • Click on the name of your Scenario and select SHOW to display the changing cell values and the new result in your target cell.
  • If you wish, choose SUMMARY to create a summary report in a separate worksheet.
  • I strongly recommend that you create named cells and use them in the formulas and changing cells of your Scenario.

NEW! Download the Excel Practice file used in this lesson:

Use my Index to search for the free Excel Training Video that you want to view.

New! Danny’s DVD Training Series, “The 50 Best Tips …” is now available at the online store for The Company Rocks

Related Videos

Share and Enjoy:
  • Add to favorites
  • Facebook
  • Twitter
  • Technorati
  • Print
  • email
  • Digg
  • StumbleUpon
  • del.icio.us
  • Yahoo! Buzz
  • Google Bookmarks
  • Orkut
  • SphereIt
  • Sphinn

What is an Interactive Excel Workbook? Please Vote

I created this short video for two reasons:

1)  To demonstrate what an “Interactive Excel Workbook” looks like. Interactive Excel files are “published” to an Internet or Intranet browser. You save an Excel Workbook as a “Web Page.” Adding “interactivity” is an option that you can select.

Notice that there are no Menus and there is only one toolbar. Also, you activate the other worksheets in a different way.

I am happy to make these Practice files available to you – if there is sufficient interest.

2) Please signify your level of interest by taking the POLL on the sidebar of this page. It is fast and easy – there is only one question; and only one choice, “Yes” or “No.”

I hope to hear from you!

Go to my new page to download the Interactive Excel Practice Files
Thanks in advance!

Danny Rocks

News! My DVD, “The 50 Best Tips for Excel 2007” is now available to purchase. I invite you to visit my online bookstore for more details.

Share and Enjoy:
  • Add to favorites
  • Facebook
  • Twitter
  • Technorati
  • Print
  • email
  • Digg
  • StumbleUpon
  • del.icio.us
  • Yahoo! Buzz
  • Google Bookmarks
  • Orkut
  • SphereIt
  • Sphinn

Do You Want Copies of My Excel Workbooks?

I have a question for you?

I just added an “interactive copy” of my Excel Workbook for my video lesson – “Rearrange Your Columns – Sort from Left to Right”

Here is the link to the workbook.

My question is: Should I go back and add links to the Excel Workbooks for earlier lessons? To make it easy for you to respond, I have included a quick poll to the right sidebar on this page (at the bottom of the sidebar).

Thanks in advance for your response!

Danny

Sorry, there are no polls available at the moment.

News! My DVD, “The 50 Best Tips for Excel 2007” is now available to purchase. I invite you to visit my online bookstore for more details.

Share and Enjoy:
  • Add to favorites
  • Facebook
  • Twitter
  • Technorati
  • Print
  • email
  • Digg
  • StumbleUpon
  • del.icio.us
  • Yahoo! Buzz
  • Google Bookmarks
  • Orkut
  • SphereIt
  • Sphinn