How to Create a Summary Report from an Excel Table

Functions for Executive Summary

Functions for Executive Summary

I created this Excel Video Tutorial in response to a viewer who, in her company, is not permitted to use a Pivot Table to create a report. Unfortunately, this happens more often than you might think. Nevertheless, I promised to share my tips and advice. I think that many of this tips will help Excel users at all levels.

Tips Covered in this Video Tutorial

  • Use Advanced Filter to Extract a list of unique customer names from a range with @ 4,300 records.
  • Later in the lesson, I show you how to extract this list to a different worksheet – a tip that will save you time when preparing your reports!
  • How and why to convert a normal range of data into a TABLE in Excel 2007 / 2010 or into a LIST in Excel 2003.
  • How to create “Named Ranges” for your key data cells and to use them in your Formulas and Functions.
  • How to use the SUMIF, AVERAGEIF and COUNTIF Functions in your summary report.

Keyboard Shortcuts Used in this Tutorial

  • Ctrl + T to convert to a TABLE in Excel 2007 / Excel 2010
  • Ctrl + L to convert to a LIST in EXCEL 2003
  • Ctrl + A to open up the Function Arguments Dialog Box
  • Ctrl + Shift + F3 to open the Create Names Dialog Box
  • F3 to open the Paste Names Dialog Box

I decided that I will only make this video available on YouTube – I think that you will enjoy the clarity that you get from the High-Definition / Full Screen Mode.

Watch Tutorial in High Definition on YouTube

Follow this link to view this Excel Tutorial in High Definition on my YouTubeChannel – DannyRocksExcels

Visit my new secure online shopping website

I invite you to visit http://shop.thecompanyrocks.com – my new online shopping website.

Watch Video Now

Three and a Half Ways to Average Excel Data Using Criteria

AverageIf Function in Excel

AverageIf Function in Excel

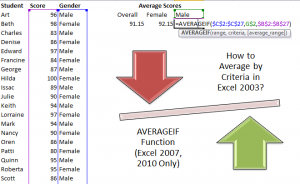
It is easy to use Excel’s AVERAGE Function to get the average for an entire range of data. But, what if you are asked to produce a report that shows the average for select groups of records – for example, average test results for the female students only; or for the male students only? What approach do you take? What Functions do you use to produce this report?

Three and a Half Ways to Produce this Report

  • SUBTOTALS – Easy to use. Remember to sort your data first using the field that you want to subtotal.
  • AVERAGEIF Function – Very easy to use. Only works in Excel 2007 and Excel 2010.
  • DAVERAGE Function – Will work in any version of Excel. Easy to add or change the Criteria.
  • PIVOT TABLE – Very easy to create. No need to write a formula. Create report with @ 6 mouse clicks!

My Preferred Approach – Create a Pivot Table Report

While Pivot Tables are the most powerful tool in Excel, they are also one of the easiest tools to use in Excel! Why?

  • Because you can create a Pivot Table Report without writing a single formula!
  • You can create this Pivot Table Report with about six clicks of the mouse.
  • You cannot possibly harm your underlying data when you create Pivot Tables!

Download a One Hour- Plus / In-depth Video Tutorial on Pivot Tables – for $9.95

I have created a series of Excel Video Tutorials that you can download for $9.95 US Dollars each. Here is a link to my informational page that gives you the details.

  • Are you Using Excel 2003? – I created a video recording for Pivot Tables using Excel 2003 that you can download for $9.95!
  • Are you Using Excel 2007? – I created a video recording for Pivot Tables using Excel 2007 that you can download for $9.95!
  • Are you Using Excel 2010? – I created a video recording for Pivot Tables using Excel 2010 that you can download for $9.95!

As with all of my products, I guarantee that you will be 100% Satisfied or I will refund your purchase price – no questions asked!

My Extended length Excel Training Video Recordings are hosted at: http://thecompanyrocks.webex.com – I use the secure shopping cart at WebEx by Cisco Systems, so you can be sure that your personal information is safe and secure.

Watch Video in High Definition on YouTube

Follow this link to watch this video tutorial in High Definition mode on my YouTube Channel – DannyRocks Excels

Get My DVD-ROM, “The 50 Best Tips for Excel 2007” for only $29.97

How to Use the Average Functions in Excel 2007 and 2010

The new AVERAGEIF and AVERAGIFS Functions were introduced in Excel 2007. In this lesson, I demonstrate how and when to use both functions. If you are using an earlier version of Excel – e.g. Excel 2003, I show you how to use a Pivot Table to produce the same results.

Average is not the Median

The Average Function is the “Arithmetic Mean” of the range of cell values. This means the Sum of the values in the range divided by the Count of the cells with numeric values in the range. Many people confuse this with the MEDIAN sale which is the “middle value” in the range. Half of the cell values are above and half of the cell values are below the result of the MEDIAN() Function.

New AverageIfs Function in Excel

AverageIfs Function

New Functions in Excel 2007

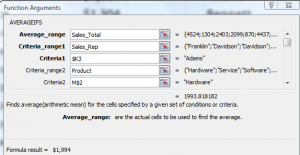
Watch the video to see how to use both the AverageIf and AverageIfs Functions. I recommend using the Function Arguments Dialog Box and Named Cell References with these functions. Pay attention to my use of “Mixed Cell References” in the AverageIfs formula. Doing so makes it easy to write the formula in one cell and then copy it across the range of cells.

Here is the link to watch this video tutorial in High Definition on my YouTube Channel.

Learn how you can “Master Excel in Minutes – Not Months!”