This is the first in a series of tutorials that I am creating in partnership with Tri-Technical Systems – a leading provider of Point-of-sale (POS) Systems. In this video lesson, I use an Excel Pivot Table to present the information that I require from a standard “Inventory by Location” report.
Point-of-Sale Reports
Most POS Systems allow you to print out standard reports – compact, professionally formatted “snapshots” of your inventory status, sales data and customer information. Likewise, most POS Systems will allow you to easily export the data behind these reports to Excel – where you can analyze or “number crunch” the data.
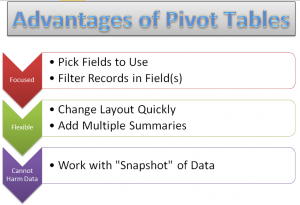
Advantages of Pivot Tables
- Pivot Tables combine the best elements of Subtotals, Outlines and Filtered Reports.
- With a Pivot Table, you select only the Fields that you wish to focus on.
- You can quickly reposition any field on your Pivot Table – e.g. change it from a Vertical to a Horizontal position.
- Pivot Tables allow you to easily add multiple summaries – e.g. Sum, Average, Percentage of Total, etc. without writing a Formula!
- It is impossible to harm your underlying data when you work with a Pivot Table because you are working with a “virtual snapshot” of your data. You cannot directly change any value in a Pivot Table Report!
Learn More About Pivot Tables
Pivot Tables are easy to learn. However, it does take practice if you want to really tap into the analytical power of a Pivot Table Report. Fortunately, I have a great resource for you – a 90 minute focused video tutorial on Pivot Tables. Follow this link to go to the information page for my Excel 2010 Pivot Table DVD-ROM. I have also created Pivot Table videos for Excel 2007 and Excel 2003.
Watch Tutorial in High Definition
You can watch this Excel Tutorial in High Definition on my YouTube Channel – DannyRocksExcels
View My Video Now

