Archives for October 2011

Structured Formula References in Excel 2007 and Excel 2010 – Part 2

Compare Structered References Excel 2007 v 2010

Compare Structured References 2007 v 2010

This is the second and concluding part of this series where I demonstrate how to use Structured Formula References when referring to Excel Tables.

Key Points Covered

  • The difference between Structured Formula References in Excel 2007 and Excel 2010
  • How to Edit Structured Formula References
  • How to Write Structured Formulas using the new Formula AutoComplete drop-down menu


Watch My Video Tutorial Now


Watch Video in High Definition on YouTube

Click on this link to watch this Video in High Definition on my YouTube Channel – DannyRocksExcels

Go to Part 1 in this Series of Video Tutorials

Follow this link to go to Part 1 in this Series of Tutorials about using Structured Formula References in Excel Tables.

Visit My New Secure Online Store

I have just published 6 New Products and opened a new, revised, secure online shopping website. Take a look at: http://shop.thecompanyrocks.com
 

Master Excel Pivot Tables in 90 Minutes: Announcing My New Extended Length Video Tutorials!

Master Pivot Tables in Minutes

Master Pivot Tables in Minutes

I am proud to announce the publication of my new series of “Extended Length” video tutorials: “Master Excel Pivot Tables in 90 Minutes!”

Now, you can can get an in-depth video tutorial, so that you can Master Excel Pivot Tables with 90 minutes of video instruction. You also receive the actual Excel Workbook file that I used while filming the video lessons as well as a printed step-by-step instructional manual.

What Makes this Product Unique?

  •  Excel Versions for the Video Tutorials

  • Available for Excel 2010, Excel 2007 or Excel 2003

Multiple Options for Delivery

Resources to Assist Your Learning

  • The Excel Workbook file that I used while filming each video lesson – Included with purchase!
  • PDF Manual of Step-by-Step Instructions – That you can print out – Included with purchase!

Take a Short Video Tour

Follow this link to watch a short – 5 minutes – video tour of my new products on my YouTube Channel – DannyRocksExcels

Visit My New Secure Online Shopping Website

I invite you to visit http://shop.thecompanyrocks.com This is my new online shopping website. I have created secure shopping carts to ensure that your privacy is protected. I also offer a 100% Customer Satisfaction Policy. If, for any reason, you are not 100% satisfied with any of my products, I will refund your purchase with no questions asked!

Danny Rocks

The Company Rocks

How to Use Structured Formula References for Tables in Excel 2007 and Excel 2010

Structured Formula Reference - Excel 2007

Structured Formula Reference - Excel 2007

Beginning with Excel 2007, you can – and should – convert a Standard Data Range to an Excel Table. Doing so offers several advantages:

  • You get a selection of Table Styles – including Alternate Row Shading – that make it easier to read your tables.
  • You can automatically extend the Scope of your Table – by adding additional Fields (Columns) or Records (Rows).
  • You can give your Table a “Name” to reflect the purpose of the Table.
  • You can add a Total Row to Subtotal each Field (Column) and you can change the Function used to Subtotal from a drop-down menu.
  • You can apply Structured Formula References in the Table – Enter the Formula in a Single Cell and it is Automatically copied down for each record in the Table.

“In This Row” Formula Styles

Structured Formula References use a new style of formulas. Rather than referring to a specific Cell, in an Excel Table, you refer to a Field “in this row.” This type of formula is easy to create “inside the table.” It is also fairly easy to create “outside the Table” using the new Formula AutoComplete tool. You will be using [ ] (Left & Right Brackets) for these formulas. I go over these details, in-depth, in this video tutorial.

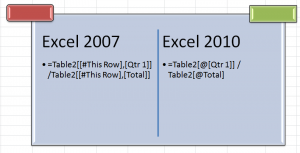
There are also distinct differences in how Structured Formula References are created between Excel 2007 and Excel 2010. These Structured Formula References are greatly streamlined in Excel 2010 – in my opinion.

The SUBTOTAL() Function and Excel Tables

I strongly recommend that you become familiar with how to use the valuable SUBTOTAL() Function in Excel when referring to the data in a Table. With the SUBTOTAL Function, you can produce a wide range of summaries anywhere on your Excel Workbook. And… the Subtotal Results reflect the totals for any “Filters” that you apply to your Table.

Play this Video in High Definition

Watch this Video in High Definition

Follow this link to watch this Excel Tutorial in High Definition on my YouTube Channel – DannyRocksExcels

Go to Part 2 in this Series of Tutorials

Follow this link to go to Part 2 in this series of tutorials about using Structured Formula References in Excel Tables.

Announcing 6 New Products on My New Online Secure Shopping Website

I invite you to visit my new online shopping site. I have added 6 new products – Extended Length Video tutorials that you can either “download now” or purchase as a DVD-ROM. Each product contains over 90 minutes of in-depth video instruction for Pivot Tables. You can choose the product to fit your version of Excel – Separate products for Excel 2003, Excel 2007 and Excel 2010.

Click here to view my new products.

How to Use the Show As Values Dialog Box for an Excel Pivot Table

Show Values As for Pivot Table

Show Values As for Pivot Table

I created this Excel Video Tutorial in response to a viewer who wrote to me about a problem that he was having with an Excel 2007 Pivot Table.

Viewer’s Question

“I want to show both the % of Growth from Fiscal Year-to-Year and the Actual Variance in Volume between each of 3 Fiscal Years. I have been trying to do this with a Pivot Table Calculated Field, but I am not having any luck with this approach. What do you suggest?”

My Solution

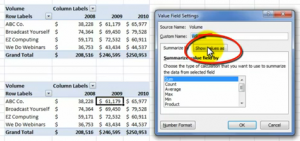
Use the “Show values As” Dialog Box which you find in the Value Field Settings Dialog Box. I continue to be amazed, when I teach Pivot Tables in a Live Seminar, that the high majority of my students have never clicked on this Tab!

In this case, we are working with a “copy” of the original Pivot Table. Simply choose “% Difference From” in the drop-down menu. Next, choose Fiscal Year and Previous (year) to create a Fiscal Year-over_Fiscal Year Report. It is so easy to do! And… you do not have to write a single formula to create this report!

Watch Video Here on My Website


Watch Excel Tutorial in High Definition

Follow this link to view this Excel Tutorial in High Definition Mode on my YouTube Channel – DannyRocksExcels

Master Excel Pivot Tables in 90 Minutes!

Follow this link to learn about my new extended length (90 minutes) Pivot Table Video Tutorials